Tag Archive: healthcare

  1. The NHS capacity crisis hiding in plain sight. Why small changes deliver the gains that big programmes never do.

    Comments Off on The NHS capacity crisis hiding in plain sight. Why small changes deliver the gains that big programmes never do.

    Every NHS trust has a capacity problem. Almost none of them have accurately measured where that capacity is actually going. Those are connected facts, and the connection between them is where most improvement programmes quietly fail.


    The wrong unit of change

    When an NHS service faces a capacity crisis, the response follows a familiar pattern. A review is commissioned. Options are assessed. The conclusion almost always involves more: more sessions, more staff, more space, more budget. The scale of the problem is matched, in theory, to the scale of the solution.

    This instinct is understandable. It is also, in most cases, wrong.

    The problem with large-scale capacity interventions is not that they never work. It is that they consistently overestimate what resource can achieve when the underlying constraint has not been precisely identified. You can add a session to a service that is losing capacity through poor flow sequencing and find that the new session loses capacity at exactly the same rate. The resource has changed. The constraint hasn’t.

    The more productive question is not how much resource to add. It is where, precisely, is the capacity being lost, and what is the smallest targeted change that moves that specific constraint. That question requires data. It requires measurement at a level of granularity that most NHS services do not currently apply to their own operations. And it requires a methodology that prioritises speed of action over scale of intervention.


    What marginal gains actually means in an operational context

    The aggregation of marginal gains is a concept most people associate with elite sport. James Clear’s Atomic Habits brought it to a general audience: the idea that a one percent improvement in each of many small areas compounds over time into results that dwarf what any single large change could achieve.

    Clive Woodward’s transformation of England rugby is the example that belongs in this conversation. Woodward did not inherit a squad of world-class players and win the World Cup. He identified every single variable that affected performance, many of them things previous coaches had not thought to measure, and improved each one incrementally. The analytical rigour he applied to marginal factors, nutrition, sleep, video analysis, legal strategy, was as important as any tactical decision on the pitch. England won in 2003 because of a system, not a moment.

    The parallel with NHS operational improvement is exact. Services that improve sustainably do so not because they find one transformational change but because they build a system for identifying, prioritising, and compounding small improvements continuously. The methodology is the advantage.

    What is missing from most NHS improvement programmes is precisely that: the systematic identification of where the marginal gains are, the prioritisation of which ones to take first, and the measurement infrastructure to know whether each change has worked before moving to the next.


    Two case studies in small changes with large consequences

    The following observations are drawn from anonymised analysis of high-volume acute outpatient services. No patient-identifiable data is used or referenced.

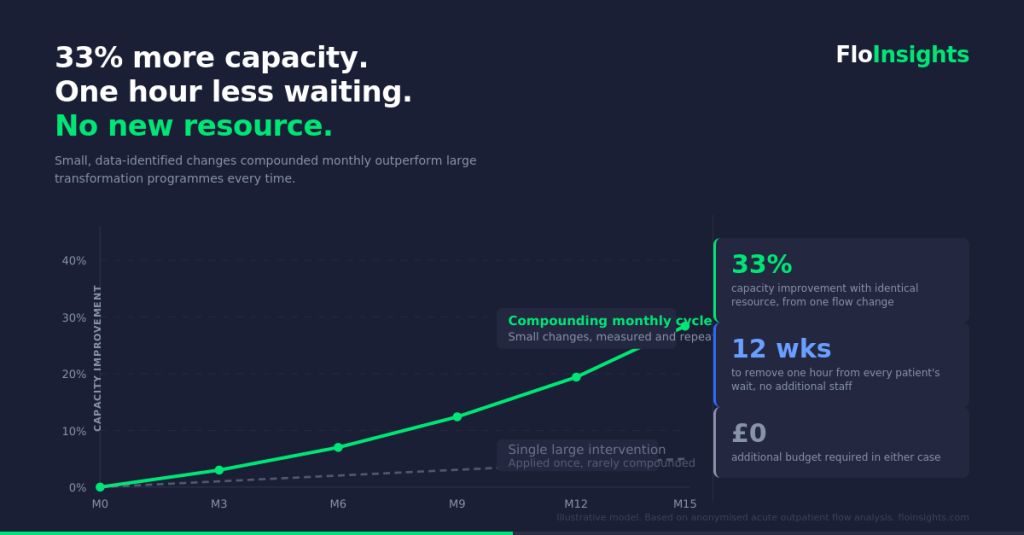
    Case one: one hour removed from every patient’s wait in twelve weeks

    A high-volume acute outpatient service was experiencing waiting times that its team attributed to insufficient staffing. The instinct was to request additional resource.

    Before any resource decision was made, pathway flow data was analysed across the four quotients of the FloInsights Benchmarked Operating System: Workforce, Patient Flow, Space and Equipment, and Finance. The analysis identified that the constraint was not total staffing level but load distribution. Resource was not evenly matched to demand across the session. At specific points in the pathway, a bottleneck was forming that downstream capacity could not recover from.

    The intervention was precise: accurate load balancing and targeted redeployment of existing resource to the point of constraint. No new staff. No new budget. No reorganisation.

    Within twelve weeks, patient waiting time had reduced by one hour per patient across the service. The capacity had always been there. The data made it visible and the prioritisation made it actionable.

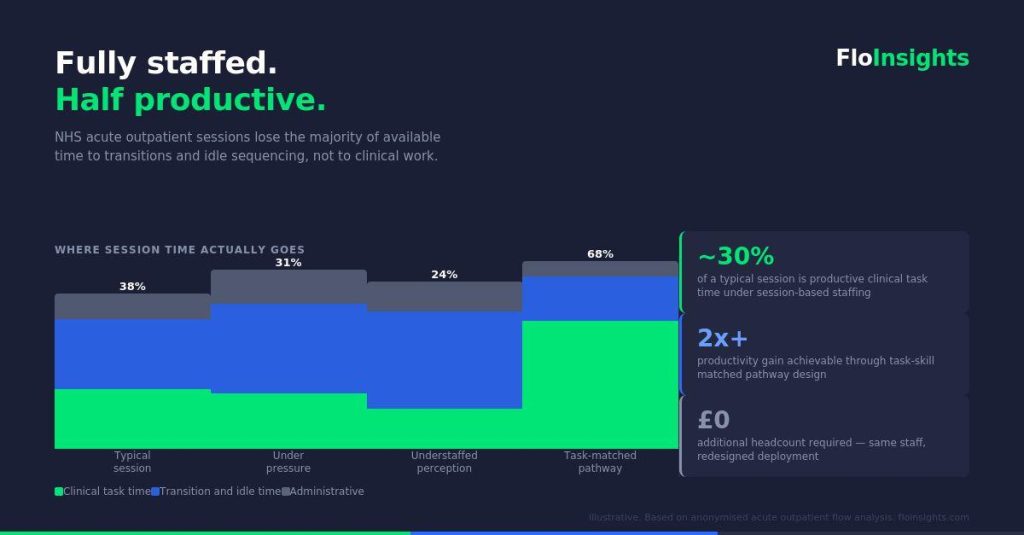
    Case two: 33% more capacity from one flow change

    A second service was operating at a level that clinical and operational leads considered close to maximum capacity. The consultant, the highest-cost and most clinically scarce resource in the pathway, was involved at multiple points across the patient journey, many of which did not require consultant-level skill.

    The analytical question was simple: what in this pathway can only the consultant do? The answer, when mapped against actual task data, was narrower than anyone had assumed. A significant proportion of consultant time was being consumed by tasks that, with appropriate support and redesign of the surrounding pathway, could be safely and effectively handled at a different skill level.

    The initial change was small. A single adjustment to the flow sequence, redistributing one category of task away from the consultant and building support around the remainder of the patient journey.

    The result was a 33% improvement in capacity with identical resource. The consultant was freed to work at the top of their clinical capability. The pathway was faster. Patients moved through more efficiently. The service could absorb more volume without adding cost.

    One flow change. A third more capacity.


    Why this keeps not happening

    If small, targeted, data-identified changes consistently outperform large resource interventions, the question is why NHS services don’t pursue them systematically.

    The answer has several components.

    The data is not in usable form. Session-level activity data is abundant. Pathway-level flow data, the kind that shows precisely where time accumulates, where constraints form, and where the highest-value intervention points are, is rare. Most services cannot see their own operations at the level of granularity required to identify marginal gains. They know roughly what happens in a session. They do not know exactly where each minute goes.

    The prioritisation framework doesn’t exist. Even where data is available, the question of which change to make first is not systematically answered. Improvement programmes tend to be driven by clinical opinion, management instinct, or political priority rather than by a structured analysis of which intervention delivers the greatest gain for the smallest disruption. The result is that available improvement energy is not always directed at the highest-value opportunities.

    The measurement cycle is too slow and requires too many hours, too much effort. It is episodic. NHS improvement programmes typically evaluate impact over months or years. By the time data confirms whether an intervention has worked, the operational context has changed, staff have moved on, and the learning is lost. A monthly measurement cycle, tied directly to the specific change that was made, is what allows gains to compound rather than dissipate.


    The Benchmarked Operating System

    The FloInsights BOS, Benchmarked Operating System, is built around the insight that the methodology is the advantage.

    Analysis is structured across four quotients: Workforce, Patient Flow, Space and Equipment, and Finance. Each quotient surfaces a different dimension of where capacity is being generated or lost. Together they provide a complete operational picture that session-level data alone cannot deliver.

    From that benchmarked baseline, rapid, data-driven and prioritised action plans are generated. Not large transformation programmes. Specific, small, high-value interventions identified by the data and sequenced by impact. The smallest change with the greatest consequence goes first.

    Monthly measurement closes the loop. Each change is tracked against the baseline. Gains are confirmed and compounded. The next priority is identified. The cycle repeats.

    This is not a consultancy model that delivers a report and leaves. It is an operating system that builds the measurement infrastructure into the service itself, so that the capacity to identify and act on marginal gains becomes a permanent organisational capability rather than a one-off project outcome.


    The compounding argument

    Clive Woodward’s England did not improve by finding one thing that made them 33% better. They improved by finding thirty things that each made them one percent better, and building a system that kept finding the next one.

    The same logic applies to NHS acute outpatient capacity. A service that reduces waiting time by one hour in twelve weeks through one precise intervention, and then finds the next constraint, and then the next, is not on a linear improvement curve. It is on a compounding one.

    The capacity gains available to most NHS services through this approach are larger than any resource programme currently being contemplated. They do not require additional budget. They require accurate measurement, disciplined prioritisation, and a monthly cadence of action and review.

    The data to start is already in the service. The question is whether it is being used.


    These case studies are drawn from anonymised analysis of high-volume acute outpatient services. No patient-identifiable data is used or referenced. FloInsights works with NHS trusts and healthcare organisations to make pathway-level operational data visible and actionable through the Benchmarked Operating System.

    To discuss how this applies to your service, contact us at insights@floinsights.com

  2. Fully staffed. Half productive. Why NHS acute outpatient productivity stalls before the shift starts.

    Comments Off on Fully staffed. Half productive. Why NHS acute outpatient productivity stalls before the shift starts.

    The staffing model NHS services inherited was built for a different era of medicine. It was built when clinical tasks were less differentiated, when skill mix meant doctor and nurse, and when the bottleneck in outpatient care was usually the consultant’s availability. That era has gone. The staffing model hasn’t.


    The question nobody is asking

    Every operational review of an NHS acute outpatient service eventually arrives at the same conversation. Waiting times are too long. Lists are too short. The solution proposed is almost always some version of more: more sessions, more staff, more resource.

    It is a reasonable instinct. It is also, in most cases, the wrong diagnosis.

    The question that rarely gets asked is not how many people are in the room. It is whether the right skills are deployed at the right points in the pathway, in the right sequence, at the right time. Those are different questions. They have different answers. And the gap between them is where NHS outpatient productivity quietly disappears, in ways that never appear on a job plan or a rota.

    This piece makes a simple argument: the NHS staffing model for acute outpatient services is built around session coverage rather than task-skill matching, and that mismatch is a structural productivity ceiling that more headcount cannot solve.


    How NHS outpatient services are actually staffed

    The unit of workforce planning in NHS outpatient services is the session. A session is a time block, typically three to four hours, within which a defined set of staff are present and a defined number of patients are scheduled. Job plans are built in programmed activities, which are session-equivalent units. Rosters are constructed to ensure session coverage. Agency and bank staff are booked per session. Performance is measured as activity per session.

    This model has an internal logic. Sessions are plannable. They are contractually legible. They map to the way NHS facilities are booked, the way consultants’ time is contracted, and the way activity data is reported upward.

    The problem is that sessions are a time-based unit, and clinical productivity is not a time-based phenomenon. It is a sequence-based phenomenon. What determines how much valuable clinical work gets done in a given period is not how many staff are present for how long. It is whether the right skills are available at each decision point in the pathway, and whether the pathway is designed to make that matching possible.

    When those two things are misaligned, you get a service that is fully staffed on paper and structurally constrained in practice.


    What flow data shows

    Analysis of patient flow in high-volume acute outpatient settings produces a consistent and instructive picture.

    The clinical tasks within these services, the skilled assessments, the diagnostic procedures, the clinical interventions, tend to execute with high consistency. When a trained clinician performs a defined task within their competency, the duration of that task is relatively stable. It does not vary much with session pressure. It does not stretch significantly when the clinic is busy. Skilled clinical execution, in other words, is not where the variability lives.

    The variability lives between the tasks.

    When you track patients through a multi-step outpatient pathway, the time that accumulates in ways unrelated to clinical complexity is almost entirely found in transitions: the movement from one step to the next, the wait before a task begins, the moment when one clinical input has been completed and the pathway needs to advance but the next input is not ready to receive the patient.

    In a well-sequenced pathway with appropriate skill deployment, these transitions are short. In a pathway staffed by session coverage rather than task-skill matching, they lengthen. Not because anyone is working slowly. Because the sequencing of skills along the pathway has not been designed. It has been assumed.

    The practical consequence is significant. A service can have consistent clinical task durations, good individual performance, and competent staff throughout, and still run at well below its productive potential, purely because the architecture of skill deployment creates idle time between tasks that compounds across a session and across a list.


    The cost that never appears on a budget

    NHS workforce costs are almost universally reported as a cost per session or a cost per whole time equivalent. Neither metric surfaces the question of whether high-cost skills are being used on high-complexity tasks.

    Consider a typical acute outpatient pathway with three or four sequential clinical steps, each requiring a different skill level. If the staffing model has been built around session coverage rather than task-skill matching, it is common to find that senior clinical time is being consumed by tasks that sit below the threshold of that skill level, not because of negligence or poor practice, but because the session model does not distinguish between tasks. Everyone is booked for the session. The session runs. The activity is recorded.

    What is not recorded is the cost of skill misallocation: the consultant time spent on tasks a specialist nurse could safely perform, the specialist nurse time absorbed by administrative steps, the healthcare assistant capacity that sits idle while upstream bottlenecks resolve.

    This is not a minor inefficiency at the margin. In a high-volume service running multiple lists per week, the cumulative cost of skill misallocation, measured in productive clinical hours lost, can be substantial. It simply never appears as a line on a budget because the budget is not structured to make it visible.

    The financial model and the operational model are using different units. Neither surfaces the problem. So the problem persists, and the solution proposed remains the same: more sessions.


    Why job planning doesn’t solve this

    The standard NHS response to outpatient productivity concerns is job planning review. Consultants’ programmed activities are examined. Ratios of direct clinical care to supporting professional activities are scrutinised. Session allocations are adjusted.

    Job planning is a necessary process. It is not a sufficient one.

    Job planning operates at the level of the individual clinician’s time allocation. It does not model the pathway. It does not map the sequence of tasks against the sequence of skills required. It does not ask whether the skill mix present in the session matches the task mix on the list.

    A consultant can have a perfectly structured job plan and still spend a significant proportion of their direct clinical care time waiting for a pathway step that a different skill should have completed earlier, or completing a task that a different skill could complete safely and at lower cost. The job plan is clean. The deployment is inefficient. The job plan review finds nothing to change.

    Pathway-level skill deployment analysis is a different discipline. It requires modelling the patient journey as a sequence of discrete tasks, mapping the skill requirements of each task, and then asking whether the staffing model in place makes that sequence flow efficiently. It is an operational design question, not a workforce planning question in the traditional sense.


    What good looks like

    A service designed around task-skill matching rather than session coverage would look different in several specific ways.

    Skill mix would be determined by pathway task analysis rather than professional convention. The question “who needs to be in this session?” would be answered by mapping what tasks need to happen, in what sequence, and what skill level each requires, rather than by replicating the staffing pattern of the previous year.

    Sequencing would be explicit. The order in which patients move through pathway steps would be designed to minimise transition time and maximise the utilisation of scarce high-skill resource. High-cost skills would be protected from low-complexity tasks by appropriate delegation and task allocation upstream.

    Productivity measurement would operate at the task level, not just the session level. The question would not be “how many patients were seen in this session?” but “how much of each skill type was deployed on tasks matched to that skill level, and what was the flow time between tasks?”

    This is not a radical reimagining of clinical services. It is operational design applied to a sector that has largely been exempt from it. Manufacturing, logistics, and professional services have been doing task-skill matching for decades. The NHS, for understandable reasons rooted in professional structure and contractual history, has not.

    The gap between those two positions represents a significant and largely untapped productivity reserve.


    The data moat problem

    There is a reason this argument has not been made more forcefully or more frequently. It requires data that most NHS services do not have in usable form.

    Session-level activity data is abundant. Pathway-level flow data, the kind that shows task durations, transition times, and skill deployment sequences at the individual patient level, is rare. Most trusts cannot tell you how long each step in an outpatient pathway actually takes, how that varies by patient complexity or time of session, or where in the sequence idle time accumulates.

    Without that data, the argument remains theoretical. With it, it becomes actionable. You can show precisely where the deployment mismatch occurs, quantify the productive hours lost, and model the impact of redesigning the skill sequence.

    This is not a technology problem. The data exists in most services, in appointment systems, in clinic management software, in observation and audit records. It is an analytical problem: extracting, cleaning, and structuring that data in a way that makes the pathway visible as a sequence rather than as an aggregate.

    When services can see their pathways in that level of detail, the conversation changes. The question stops being “how many staff do we need?” and starts being “how do we deploy the skills we have so that each one is working at the top of its capability, in the right place, at the right time?”

    That is a more productive question. It tends to have a more productive answer.


    The implication for workforce strategy

    None of this is an argument against adequate staffing. Services need sufficient resource. The case being made here is narrower and more specific: that session-based staffing models create a structural ceiling on the productivity of whatever resource is deployed, and that ceiling cannot be raised by adding more of the same resource.

    The implication for workforce strategy is that skill mix design needs to become a first-order question in outpatient service planning, not an afterthought to headcount decisions. Pathway task analysis needs to precede staffing model design, not follow from it. And productivity measurement needs to develop the granularity to surface skill misallocation, not just aggregate activity.

    For finance directors and operational leads, this reframes the efficiency conversation. The question is not only what a session costs, but what productive clinical value that session generates per skilled hour deployed. Those are different numbers. In most services, the gap between them is larger than anyone has formally measured.

    Closing that gap does not require more resource. It requires better information about how the existing resource is actually being used, and the analytical capability to turn that information into operational decisions.

    That is a solvable problem.


    These observations are drawn from anonymised analysis of patient flow data across acute outpatient settings. No patient-identifiable data is used or referenced. FloInsights works with NHS trusts to make pathway-level operational data visible and actionable.

    To discuss how this analysis applies to your service, contact us at insights@floinsights.com